MiniTab For Mobile Guidance Description
Minitab is an application designed to perform statistical processing. Minitab combines the ease of use of Microsoft Excel and SPSS with the ability to perform complex statistical analysis. Minitab is the leading choice of software for statistics education programs at more than 4,000 colleges and universities worldwide.
Features especially useful for Minitab users include:
* Basic Statistics: Minitab's features cover all types of statistical tests, descriptive statistics, correlations and covariance.
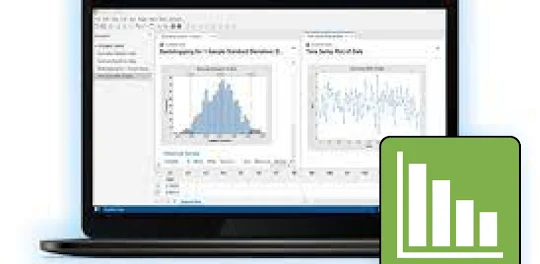
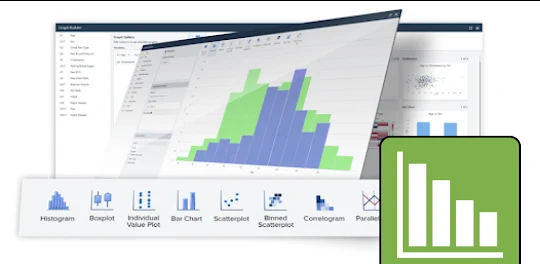
* Graphs: Minitab Statistics allows users to draw various statistical graphs such as scatter plots, histograms, box plots, matrix plots, marginal plots, bubble charts, etc.
* Regression: This feature allows Minitab users to find relationships between variables (which is a key feature of any statistical tool).
* Statistical Process Control: This Minitab feature helps you create cause and effect charts, variable control charts, multivariate control charts, time weighting charts, etc.
Minitab Statistical Guidance will provide a Brief Introduction about Minitab Statistical Software. This introduction to Minitab is meant to provide you with enough information to get you started. Minitab is statistical software that allows you to enter data to perform various statistical analyzes on it.
Disclaimer:
This Mini tab Statistics Guidance App is not an official app, not associated or affiliated with the developer of any app or their partners. This Mini tab Statistics Guidance App follows the "fair use" guidelines by US law, if you feel there is a direct copyright or trademark violation that doesn't follow within the "fair use" guidelines, please contact us directly.
Features especially useful for Minitab users include:
* Basic Statistics: Minitab's features cover all types of statistical tests, descriptive statistics, correlations and covariance.
* Graphs: Minitab Statistics allows users to draw various statistical graphs such as scatter plots, histograms, box plots, matrix plots, marginal plots, bubble charts, etc.
* Regression: This feature allows Minitab users to find relationships between variables (which is a key feature of any statistical tool).
* Statistical Process Control: This Minitab feature helps you create cause and effect charts, variable control charts, multivariate control charts, time weighting charts, etc.
Minitab Statistical Guidance will provide a Brief Introduction about Minitab Statistical Software. This introduction to Minitab is meant to provide you with enough information to get you started. Minitab is statistical software that allows you to enter data to perform various statistical analyzes on it.
Disclaimer:
This Mini tab Statistics Guidance App is not an official app, not associated or affiliated with the developer of any app or their partners. This Mini tab Statistics Guidance App follows the "fair use" guidelines by US law, if you feel there is a direct copyright or trademark violation that doesn't follow within the "fair use" guidelines, please contact us directly.
Open up